STEM: Science Technology and Math
Global Marketing - Websites

In our school, the "Technology" piece of STEM is integrated across the curriculum and particularly focused on in CTE (Career and Technical Education) courses.
This marketing project involved students selecting a sport to market to a specific country. The unit integrated global education and research, website design using Weebly, video production using iPads, and pre/post assessment in 21st Century Skills. We used a template created by John Warf to automatically score the assessment and get a quick sense of where students were in their skills.
We used this page of our website to organize the introduction and guide students through what parts of cultural research would be most important for marketing a sports team.
Student Samples: |
Common Core Connections:
|
Earth Science - Animoto

To integrate literacy and technology projects into Earth Science the school librarians and classroom teachers used Judy Moreillon's book Coteaching Reading Comprehension Strategies in Secondary School Libraries: Maximizing Your Impact and adapted a lesson so that kids did close reading and evaluation at the beginning of a unit to develop vocabulary and then created a technology-driven project at the end of the unit to show their learning.
Click here for the literacy lesson plan to open the unit. Click here for the handout used by students in the literacy lesson. During the introduction, the school librarian also did a "model" with the word rip currents showing how to read the different sources. At the end of the unit after vocabulary work, classroom instruction, labs, etc. Students either created short Animoto videos focusing on terminology and imagery to help peers understand it or they completed a documentary about ocean currents and how they affect oil spills or surfing. Student Sample:Vocabulary and images
Common Core Connections:
|
Chemistry - Ethical Research
Students in our chemistry classes complete an in-depth research paper and presentation each semester. Classroom teachers had concerns about student's proper use of citations, plagiarism, quality of sources and ability to take notes. We developed a "Research Introduction Stations" activity to introduce the assignment. Students came to the library and moved through 4 stations each with a different research theme. Then teachers played a game with students back in the classroom to further reinforce the learning goals.
Common Core Connections:
Anatomy - QR Code Lab
In order to increase responsbility for their own learning, students developed the material for the Bone and Joint Lab in their Anatomy class. Each small group of students was assigned a topic and were responsible for finding high-quality sources of information to share with other students during the lab. For each web source, the groups created a QR code. Students were responsible for setting up the lab, and then each student used an iPod to scan the barcode in order to complete each lab activity.
Click here for the assignment instructions and for the lab questions each student completed. Click here for instructions on creating QR Codes. Click here for the lab rubric. Common Core Connections:
|
Advanced Functions and Modeling - CultureGrams + Distribution
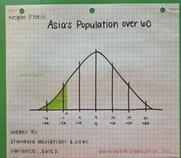
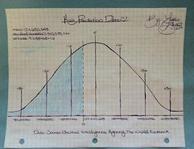
Students in AFM must understand Binomial and Normal Distrubtion, so for this assignment students were tasked with collecting data about Asia from one topic using the database CultureGrams--topics included education rates, mortality rates, poverty rates, cell-phone rates, etc. For each topic, students calculated the mean, standard deviation, and variance and then create a graph and then share the information with each other. From this collaborative data, each student analyzes the data topics for one Asian country and compare and contrast the data results for the assigned country with the date for all of Asia. Students then collect research information from CultureGrams on the assigned country to determine the reasons why the assigned country is similar to or different from the rest of the continent. Students write a one-page report explaining how their country is different from the means of Asia and the reasons for those differences.
Click here to view the list of data topics and the list of countries in Asia. Click here to view the collecting research information instructions. Student Samples:Students' charts from their initial research. The colored portion of the graph represents the non-viable standard deviation (i.e. can't have less than zero for a person's age = non-viable).
Common Core Connections:
|
Intro to High School Math -
|